Hi,
I can see new functionality to display content in graphical form.

Is there any guidance? I actually wanted to display some statistical data in graphical form but as far as I can see is to report on number of records created? Am I right?
Irene
Hi,
I can see new functionality to display content in graphical form.

Is there any guidance? I actually wanted to display some statistical data in graphical form but as far as I can see is to report on number of records created? Am I right?
Irene
Hi Irene,
Thanks for your question and happy to see that you could be interested in trying the new Chart widget. The current available mode is Proportion (pie, etc) and this mode allows to group by a specific property like "Workflow state".
If you're interested to group by creation date (i.e number of documents grouped by day created or month created), this is possible by having a property on the objects that could be computed based on the real creation datetime.
For example, you could have an automatic property for each document to say "September 2024" or even "2024-09", and then, you could create a chart to group by this specific property.
At least, this is how you could make it with the proportion mode today.
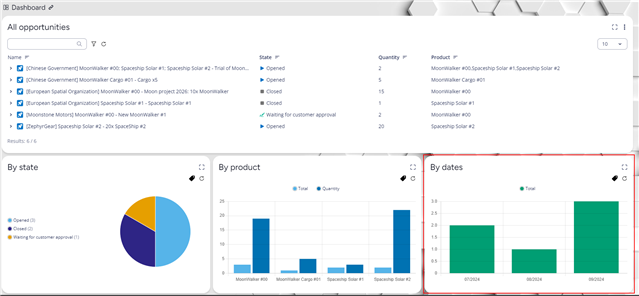
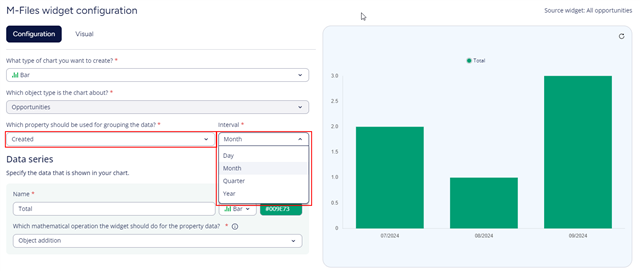
Still, as you can see in the latest product update I wrote last week: M-Files Hubshare - September 2024 Product Update a new mode is coming by the end of the month named "Series", and it will allow you to do this without creating any new property.

In the Serie mode, we have a built-in mechanism to format a property date and to do a smart grouping (i.e by day, by month, by quarter, by year).

We are thinking about implementing the same kind of native capabilities in the Proportion mode later on, but for now it will be limited to the upcoming Series mode.
Hi Irene,
Thanks for your question and happy to see that you could be interested in trying the new Chart widget. The current available mode is Proportion (pie, etc) and this mode allows to group by a specific property like "Workflow state".
If you're interested to group by creation date (i.e number of documents grouped by day created or month created), this is possible by having a property on the objects that could be computed based on the real creation datetime.
For example, you could have an automatic property for each document to say "September 2024" or even "2024-09", and then, you could create a chart to group by this specific property.
At least, this is how you could make it with the proportion mode today.
Still, as you can see in the latest product update I wrote last week: M-Files Hubshare - September 2024 Product Update a new mode is coming by the end of the month named "Series", and it will allow you to do this without creating any new property.

In the Serie mode, we have a built-in mechanism to format a property date and to do a smart grouping (i.e by day, by month, by quarter, by year).

We are thinking about implementing the same kind of native capabilities in the Proportion mode later on, but for now it will be limited to the upcoming Series mode.
thanks
© 2025 M-Files, All Rights Reserved.